
Accessing your NT performance distribution
This guide is for sonographers who wish to view their personalized NT performance distribution after logging into the BORN Information System (BIS).
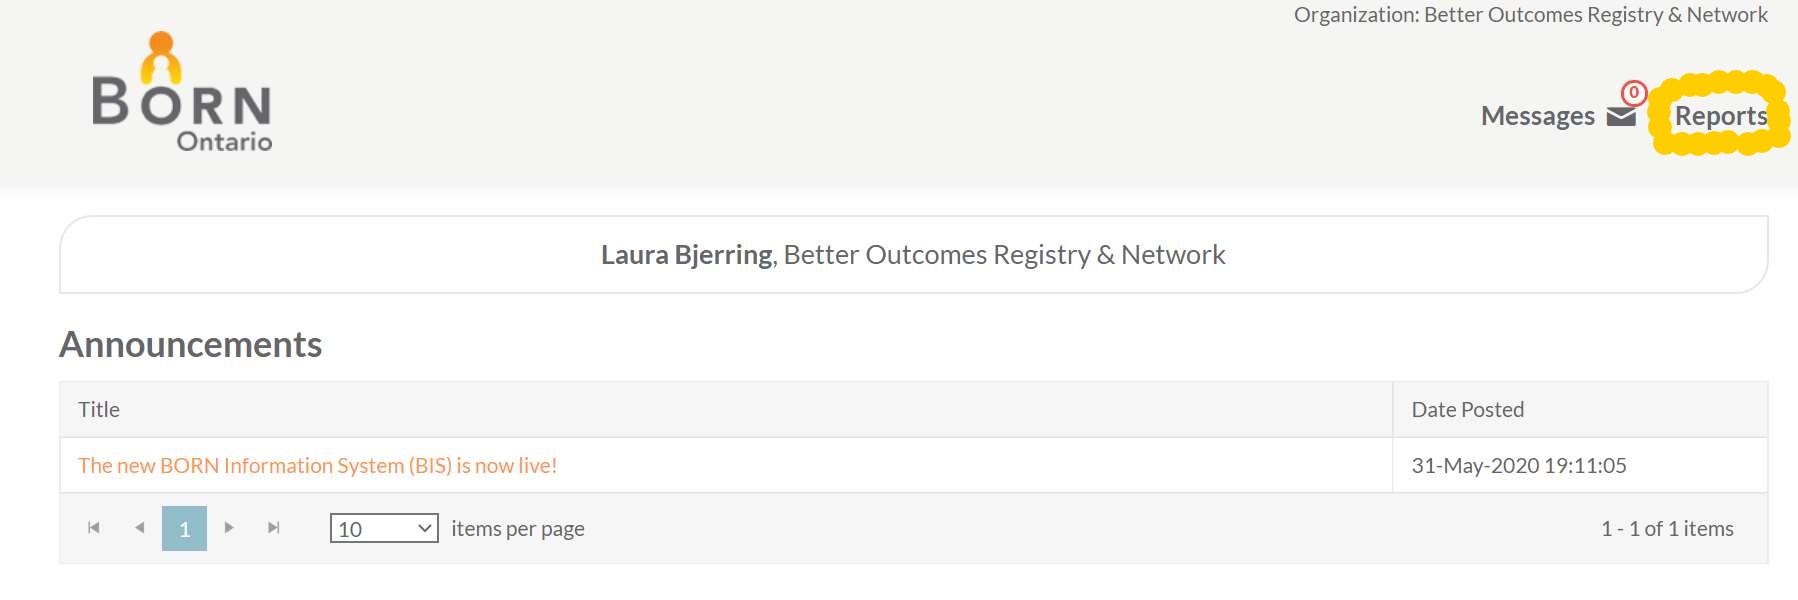
Step 1: After logging in, select "Reports".
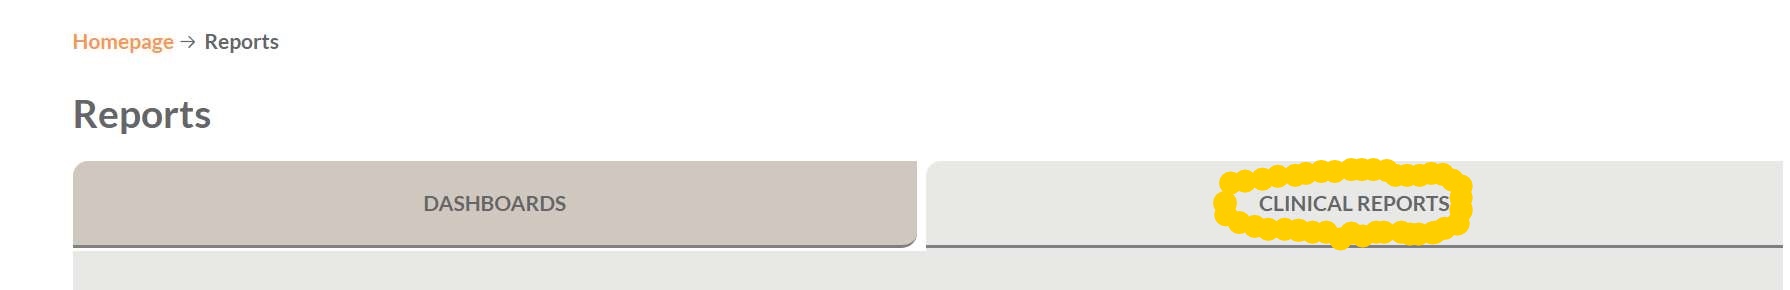
Step 2: Select "Clinical reports".
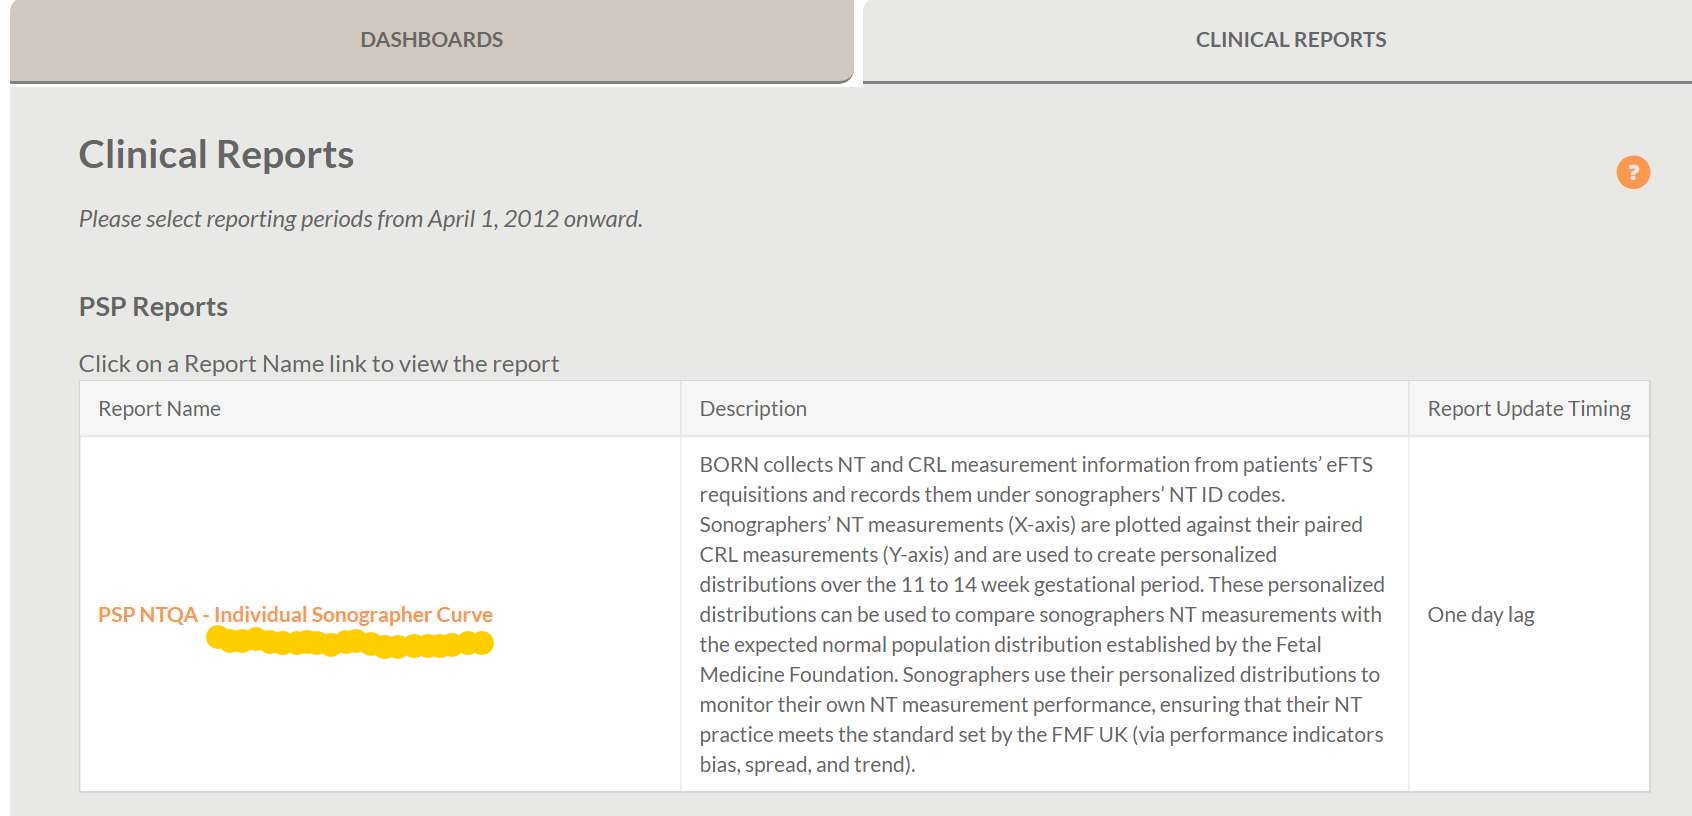
Step 3: Select "Individual Sonographer Curve"
Step 4: Select the date range you want to review, and your NT number.

*Only your NT number will be available in the drop down menu next to "Sonographer"
You can now view your report and interpret your curve
Read instructions
Contact Us
Prenatal Screening Ontario
Information Line
T. 613-737-2281
Toll-Free: 1-833-351-6490
E-Mail this contact
 Subscribe to this page